


728x90
PromQL 사용법

- Node-exporter metric(/proc, /sys 정보)
ex) node 입력 시 팝업되는 값들은 모두 node-exporter에 의해 수집되는 metric- 자동완성 기능을 통해 편하게 metric을 선택 할 수 있음
# Table 아래 쿼리 입력 후 Execute 클릭 -> Graph 확인
## 출력되는 메트릭 정보는 node-exporter 를 통해서 노드에서 수집된 정보
node_memory_Active_bytes

# 특정 노드(인스턴스) 필터링 : 아래 IP는 출력되는 자신의 인스턴스 PrivateIP 입력 후 Execute 클릭 -> Graph 확인
node_memory_Active_bytes{instance="192.168.1.105:9100"}
- kube-state-metric: 쿠버네티스 API 통신을 하여 cronjob, deployments, stateful set 정보를 가져옴
ex) kube 입력 시 팝업되는 값들은 모두 kube-state-metric에 의해 수집되는 metric
# replicas's number
kube_deployment_status_replicas
kube_deployment_status_replicas_available
kube_deployment_status_replicas_available{deployment="coredns"}

# scale out
kubectl scale deployment -n kube-system coredns --replicas 3

# 확인
kube_deployment_status_replicas_available{deployment="coredns"}

# scale in
kubectl scale deployment -n kube-system coredns --replicas 1
- kube-proxy(이미 애플리케이션 내장으로 메트릭 노출 준비 설정)
- Kubernetes의 kube-proxy에서 사용되는 성능 및 상태 모니터링을 위한 메트릭을 정의하는 코드
- iptables, IPVS, NFTables 등 프록시 모드별로 적절한 메트릭을 등록 및 관리
- Netfilter 기반의 패킷 통계(nfacct)도 지원하여 패킷 드롭 및 로컬 트래픽 모니터링 기능을 포함
kubeproxy_sync_proxy_rules_iptables_total
kubeproxy_sync_proxy_rules_iptables_total{table="filter"}
kubeproxy_sync_proxy_rules_iptables_total{table="nat"}
kubeproxy_sync_proxy_rules_iptables_total{table="nat", instance="192.168.1.188:10249"}
[ Application Metric 쿼리 - Nginx ServiceMonitor ]
- ServiceMonitor가 PodMonitor보다 상위 개념으로 더 많이 사용되고 동적으로 파드가 증가 및 삭제 되는 경우에도 자동으로 로깅 가능
[Nginx의 ServiceMonitor 설정]
- nginx 를 helm 설치 시 프로메테우스 익스포터 Exporter 옵션 설정 시 자동으로 nginx 를 프로메테우스 모니터링에 등록 가능
- 프로메테우스 설정에서 nginx 모니터링 관련 내용을 서비스 모니터 CRD로 추가 가능
- 기존 애플리케이션 파드에 프로메테우스 모니터링을 추가하려면 사이드카 방식을 사용하며 exporter 컨테이너를 추가
# 모니터링
watch -d "kubectl get pod; echo; kubectl get servicemonitors -n monitoring"

# nginx 파드내에 컨테이너 갯수 확인
kubectl describe pod -l app.kubernetes.io/instance=nginx

# 파라미터 파일 생성 : 서비스 모니터 방식으로 nginx 모니터링 대상을 등록하고, export 는 9113 포트 사용
# The chart can deploy ServiceMonitor objects for integration with Prometheus Operator installations. To do so, set the value metrics.serviceMonitor.enabled=true.
cat <<EOT > nginx-values.yaml
metrics:
  enabled: true

  service:
    port: 9113

  serviceMonitor:
    enabled: true
    namespace: monitoring
    interval: 10s
EOT

# 배포
helm upgrade nginx bitnami/nginx --reuse-values -f nginx-values.yaml

# 확인
kubectl get pod,svc,ep
kubectl get servicemonitor -n monitoring nginx
kubectl get servicemonitor -n monitoring nginx -o json | jq
kubectl get servicemonitor -n monitoring nginx -o yaml | kubectl neat

#
kubectl krew install view-secret
kubectl get secret  -n monitoring
kubectl view-secret -n monitoring prometheus-kube-prometheus-stack-prometheus
kubectl view-secret -n monitoring prometheus-kube-prometheus-stack-prometheus | zcat | more
kubectl view-secret -n monitoring prometheus-kube-prometheus-stack-prometheus | zcat | grep nginx -A 20

# [운영서버 EC2] 메트릭 확인 >> 프로메테우스에서 Target 확인
## nginx sub_status url 접속해보기
NGINXIP=$(kubectl get pod -l app.kubernetes.io/instance=nginx -o jsonpath="{.items[0].status.podIP}")
curl -s http://$NGINXIP:9113/metrics # nginx_connections_active Y 값 확인해보기
curl -s http://$NGINXIP:9113/metrics | grep ^nginx_connections_active

# nginx 파드내에 컨테이너 갯수 확인 : metrics 컨테이너 확인
kubectl get pod -l app.kubernetes.io/instance=nginx
kubectl describe pod -l app.kubernetes.io/instance=nginx

# 접속 주소 확인 및 접속
echo -e "Nginx WebServer URL = https://nginx.$MyDomain"
curl -s https://nginx.$MyDomain
kubectl stern deploy/nginx

# 반복 접속
while true; do curl -s https://nginx.$MyDomain -I | head -n 1; date; sleep 1; done- Nginx Pod의 Sidecar(웹 서버 역할) 설정을 하여 해당 pod에서 metric 데이터를 Prometheus 서버에 제공!
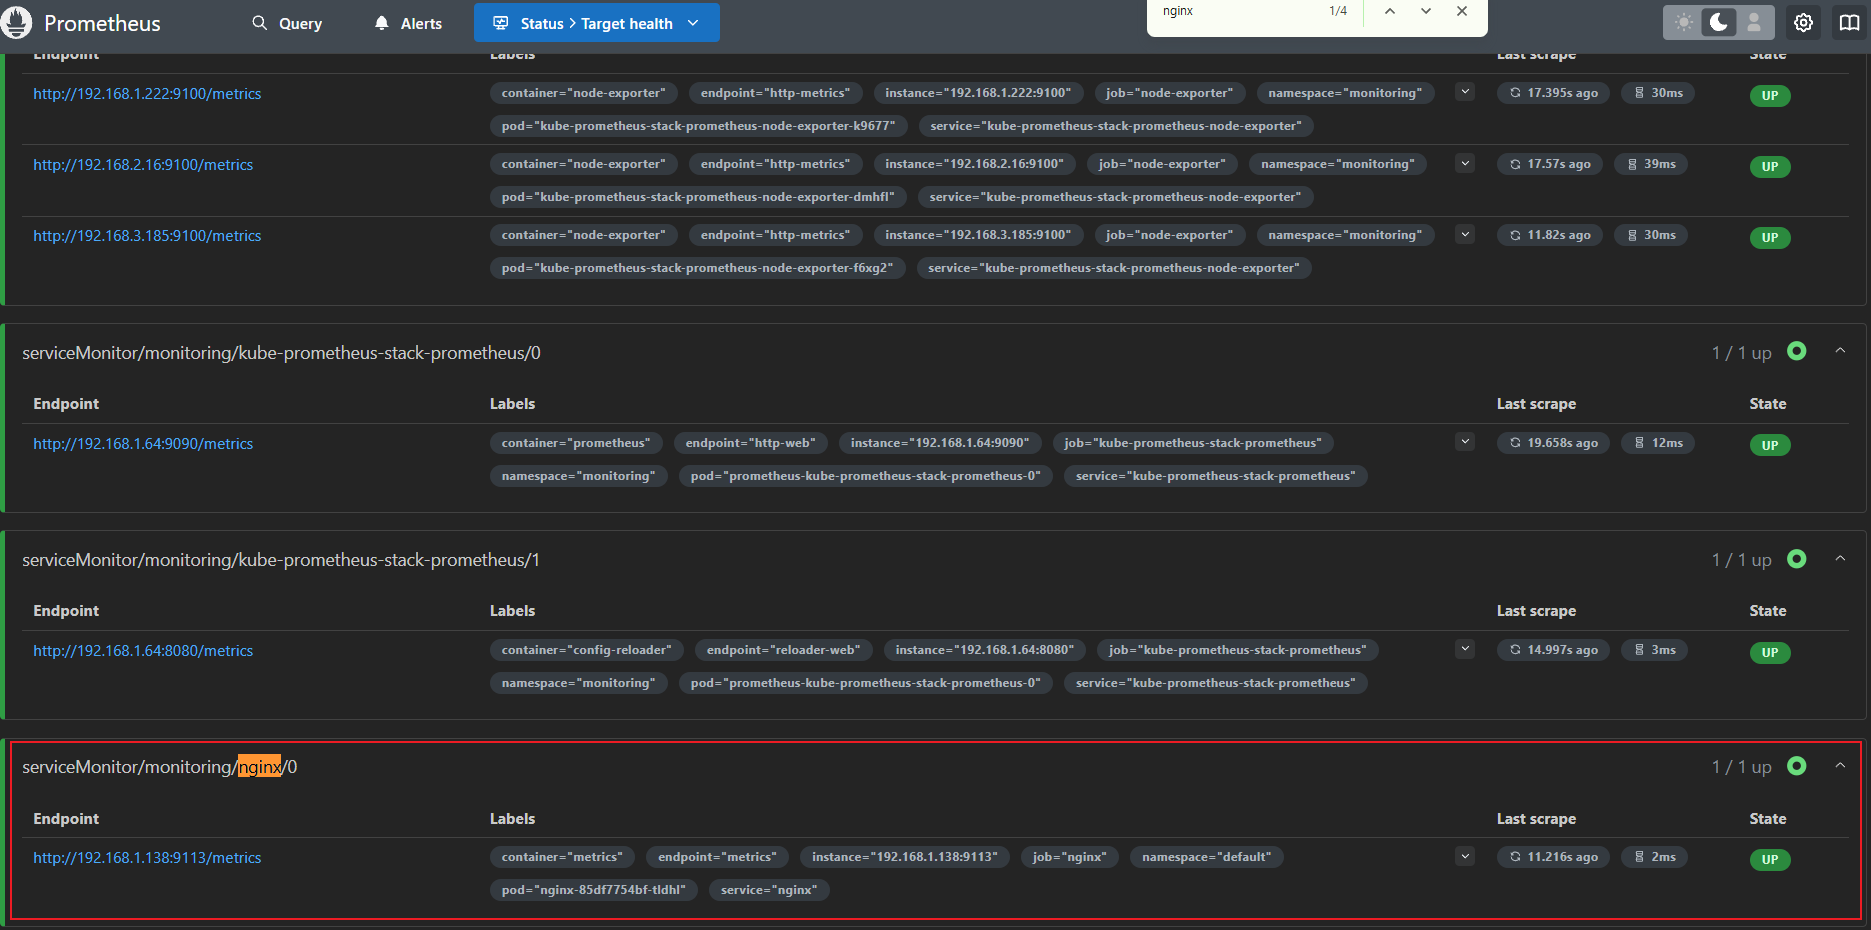
→ 설정 완료 시 Prometheus스택에서 자동 반영 - Target 확인 시 ServiceMonitor/nginx 부분이 추가된 것을 확인
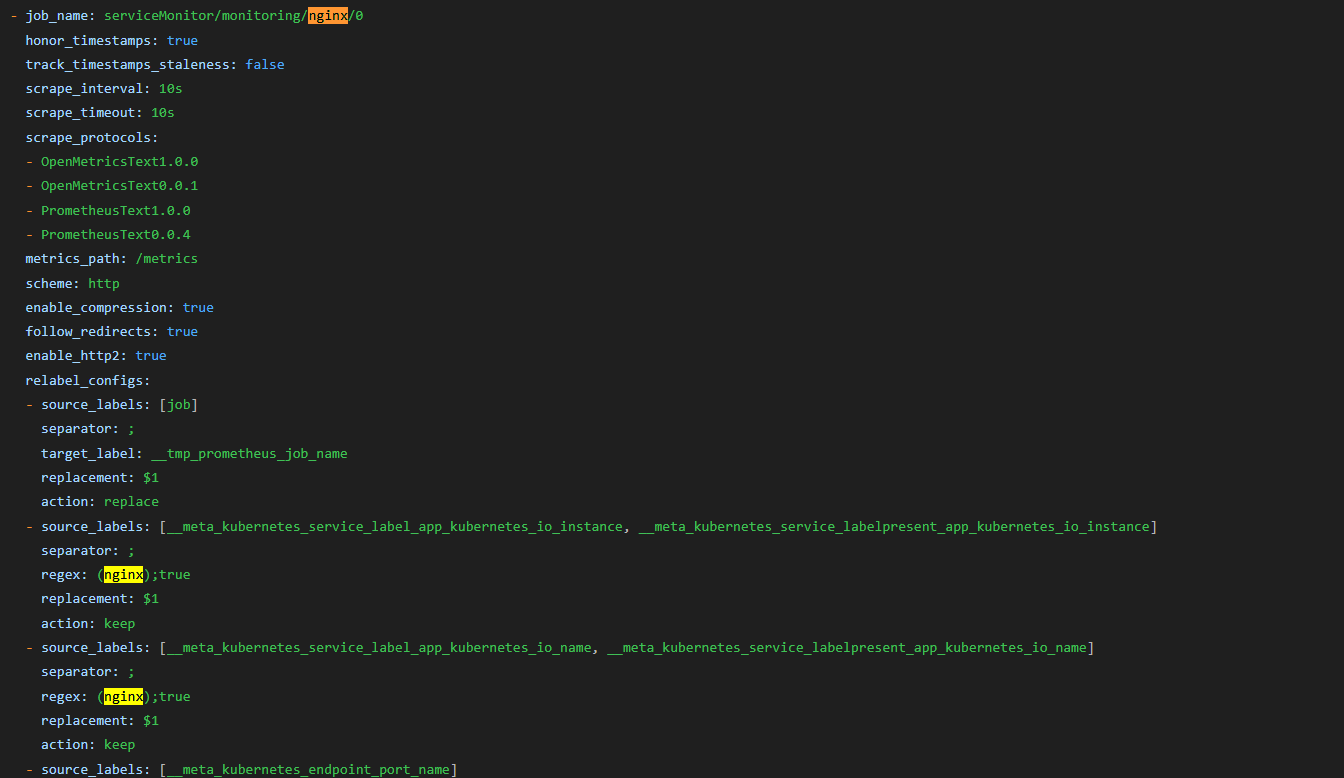
- Configuration 확인 시 job_name에 serviceMonitor/nginx 추가된것을 확인
- 자동으로 Target 등록 및 Configuration에 Job이 설정되는 이유는 Prometheus 서버 pod 확인 시 config-reloader 컨테이가 존재 → 설정이 변경되면 자동으로 적용
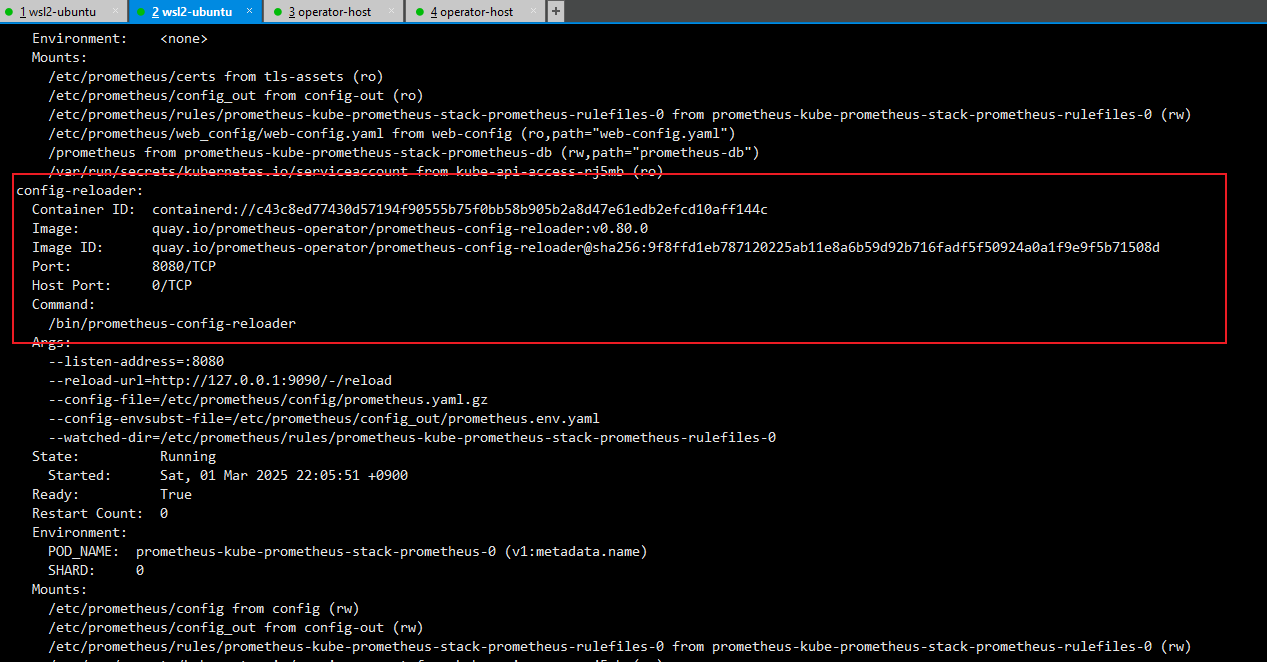
※ 동적으로 대상을 발견하고, 발견된 대상이 config 파일에 적용되고, config-reloader에 의해 자동으로 프로메테우스 서버에 적용
PromQL 사용법 (중급)
- 프로메테우스 메트릭 종류 (4종) : Counter, Gauge, Histogram, Summary
- 게이지 Gauge : 특정 시점의 값을 표현하기 위해서 사용하는 메트릭 타입, CPU 온도나 메모리 사용량에 대한 현재 시점 값
- 카운터 Counter : 누적된 값을 표현하기 위해 사용하는 메트릭 타입, 증가 시 구간 별로 변화(추세) 확인, 계속 증가 → 함수 등으로 활용
- 서머리 Summary : 구간 내에 있는 메트릭 값의 빈도, 중앙값 등 통계적 메트릭
- 히스토그램 Histogram : 사전에 미리 정의한 구간 내에 있는 메트릭 값의 빈도를 측정 → 함수로 측정 포맷을 변경
- Label Matchers : = , ! = , =~ 정규표현식
# 예시
node_memory_Active_bytes
node_memory_Active_bytes{instance="192.168.1.188:9100"}
node_memory_Active_bytes{instance!="192.168.1.188:9100"}

# 정규표현식
node_memory_Active_bytes{instance=~"192.168.+"}
node_memory_Active_bytes{instance=~"192.168.1.+"}

# 다수 대상
node_memory_Active_bytes{instance=~"192.168.1.188:9100|192.168.2.170:9100"}
node_memory_Active_bytes{instance!~"192.168.1.188:9100|192.168.2.170:9100"}

# 여러 조건 AND
kube_deployment_status_replicas_available{namespace="kube-system"}
kube_deployment_status_replicas_available{namespace="kube-system", deployment="coredns"}- Binary Operators 이진 연산자
- 산술 이진 연산자 : + - * / * ^
- 비교 이진 연산자 : = = ! = > < > = < =
- 논리/집합 이진 연산자 : and 교집합 , or 합집합 , unless 차집합
# 산술 이진 연산자 : + - * / * ^
node_memory_Active_bytes
node_memory_Active_bytes/1024
node_memory_Active_bytes/1024/1024

# 비교 이진 연산자 : = =  ! = > < > = < =
nginx_http_requests_total
nginx_http_requests_total > 100
nginx_http_requests_total > 10000

# 논리/집합 이진 연산자 : and 교집합 , or 합집합 , unless 차집합
kube_pod_status_ready
kube_pod_container_resource_requests

kube_pod_status_ready == 1
kube_pod_container_resource_requests > 1

kube_pod_status_ready == 1 or kube_pod_container_resource_requests > 1
kube_pod_status_ready == 1 and kube_pod_container_resource_requests > 1- Aggregation Operators 집계 연산자
- sum (calculate sum over dimensions) : 조회된 값들을 모두 더함
- min (select minimum over dimensions) : 조회된 값에서 가장 작은 값을 선택
- max (select maximum over dimensions) : 조회된 값에서 가장 큰 값을 선택
- avg (calculate the average over dimensions) : 조회된 값들의 평균 값을 계산
- group (all values in the resulting vector are 1) : 조회된 값을 모두 ‘1’로 바꿔서 출력
- stddev (calculate population standard deviation over dimensions) : 조회된 값들의 모 표준 편차를 계산
- stdvar (calculate population standard variance over dimensions) : 조회된 값들의 모 표준 분산을 계산
- count (count number of elements in the vector) : 조회된 값들의 갯수를 출력 / 인스턴스 벡터에서만 사용 가능
- count_values (count number of elements with the same value) : 같은 값을 가지는 요소의 갯수를 출력
- bottomk (smallest k elements by sample value) : 조회된 값들 중에 가장 작은 값들 k 개 출력
- topk (largest k elements by sample value) : 조회된 값들 중에 가장 큰 값들 k 개 출력
- quantile (calculate φ-quantile (0 ≤ φ ≤ 1) over dimensions) : 조회된 값들을 사분위로 나눠서 (0 < $ < 1)로 구성하고, $에 해당 하는 요소들을 출력
#
node_memory_Active_bytes

# 출력 값 중 Top 3
topk(3, node_memory_Active_bytes)

# 출력 값 중 하위 3
bottomk(3, node_memory_Active_bytes)
bottomk(3, node_memory_Active_bytes>0)

# node 그룹별: by
node_cpu_seconds_total
node_cpu_seconds_total{mode="user"}
node_cpu_seconds_total{mode="system"}

avg(node_cpu_seconds_total)
avg(node_cpu_seconds_total) by (instance)
avg(node_cpu_seconds_total{mode="user"}) by (instance)
avg(node_cpu_seconds_total{mode="system"}) by (instance)

#
nginx_http_requests_total
sum(nginx_http_requests_total)
sum(nginx_http_requests_total) by (instance)

# 특정 내용 제외하고 출력 : without
nginx_http_requests_total
sum(nginx_http_requests_total) without (instance)
sum(nginx_http_requests_total) without (instance,container,endpoint,job,namespace)- Time series selectors : Instant/Range vector selectors, Time Durations, Offset modifier, @ modifier
- 인스턴스 벡터 Instant Vector : 시점에 대한 메트릭 값만을 가지는 데이터 타입
- 레인지 벡터 Range Vector : 시간의 구간을 가지는 데이터 타입
- 시간 단위 : ms, s, m(주로 분 사용), h, d, w, y
# 시점 데이터
node_cpu_seconds_total

# 15초 마다 수집하니 아래는 지난 4회차/8회차의 값 출력
node_cpu_seconds_total[1m]
node_cpu_seconds_total[2m]- 활용
# 서비스 정보 >> 네임스페이스별 >> cluster_ip 별
kube_service_info
count(kube_service_info)
count(kube_service_info) by (namespace)
count(kube_service_info) by (cluster_ip)

# 컨테이너가 사용 메모리 -> 파드별
container_memory_working_set_bytes
sum(container_memory_working_set_bytes)
sum(container_memory_working_set_bytes) by (pod)
topk(5,sum(container_memory_working_set_bytes) by (pod))
topk(5,sum(container_memory_working_set_bytes) by (pod))/1024/1024
728x90
'2025_AEWS Study' 카테고리의 다른 글
| 5주차 - EKS Autoscaling(HPA/KEDA/VPA → Pod Autoscaling ) (0) | 2025.03.07 |
|---|---|
| 4주차 - EKS Observability(4) Grafana (0) | 2025.03.02 |
| 4주차 - EKS Observability(2) Metrics-server, Prometheus (0) | 2025.03.01 |
| 4주차 - EKS Observability(1) Logging (0) | 2025.03.01 |
| 3주차 - EKS Storage & Managed Node Groups(4)(NodeGroup) (0) | 2025.02.23 |